Visualise Eval results
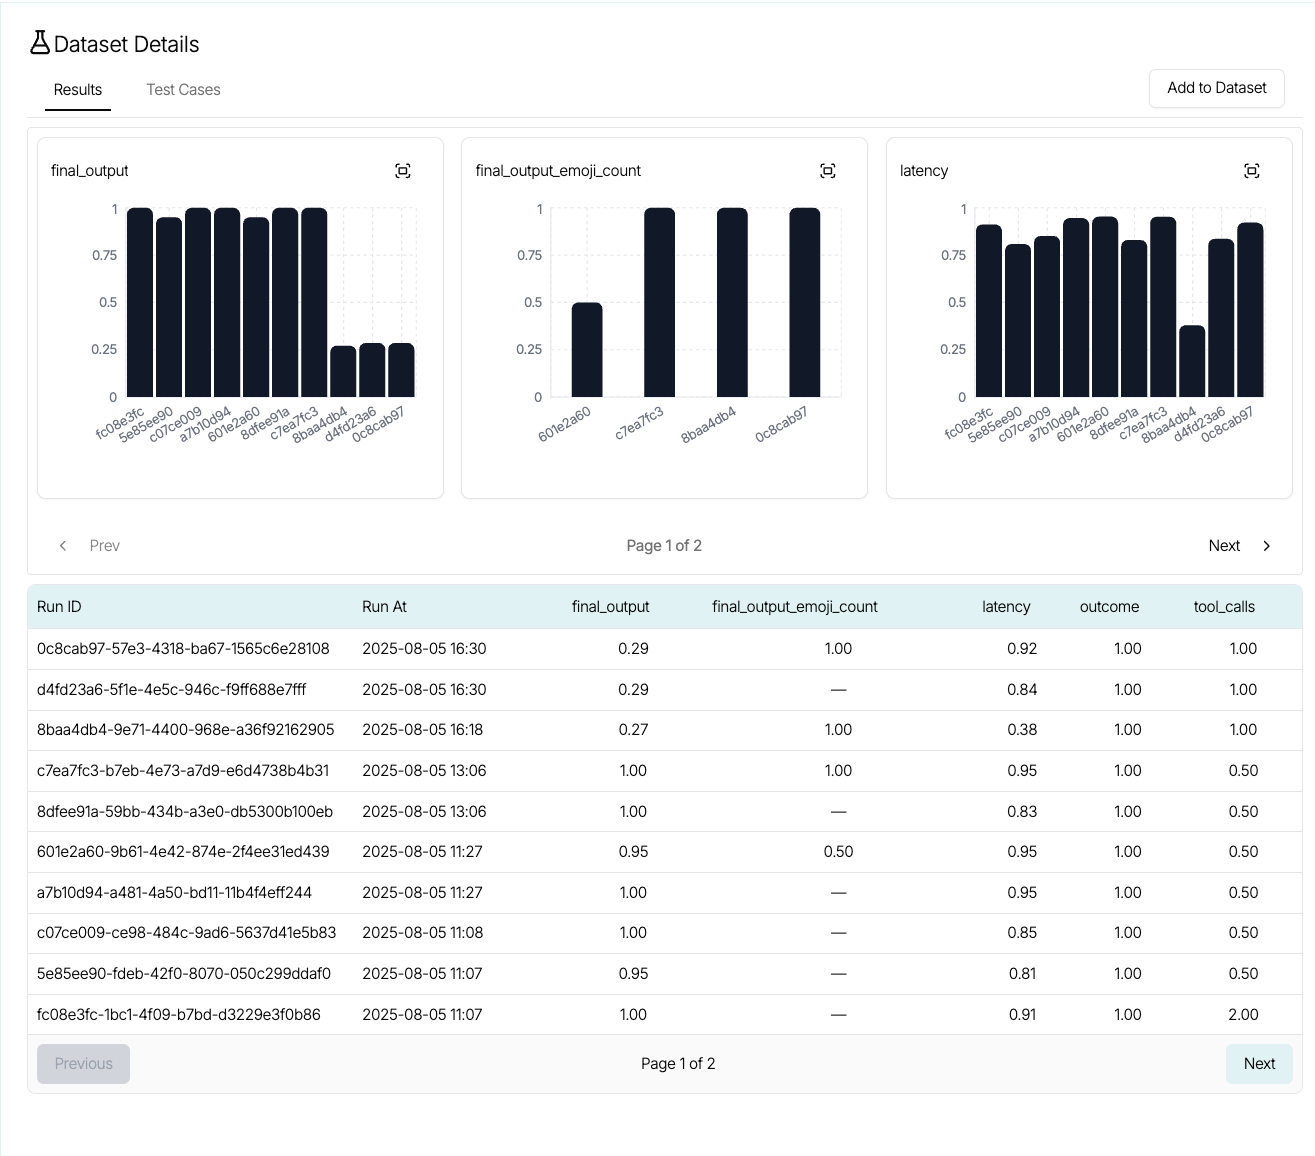
Results from Evals are pushed to the Portia UI for visualization. This allows you to quickly see trends over time and to drill into why metrics may have changed. Clicking into a dataset will show you a summary of the current metrics for that dataset. Metrics are plotted by run.
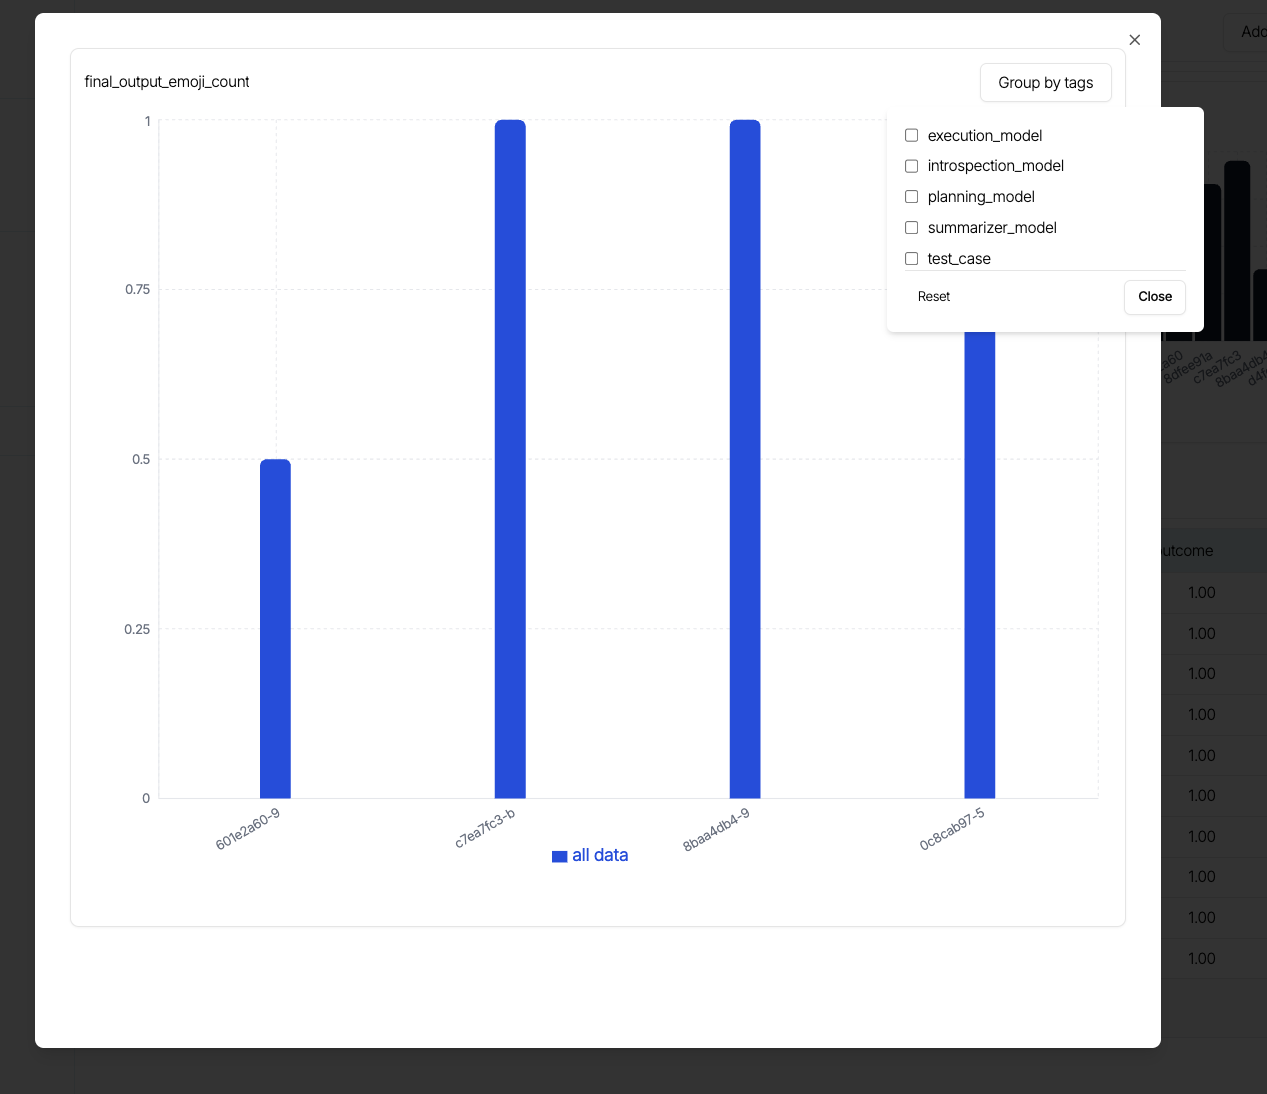
You can expand each graph to get a detailed view of the metric. This also allows you to group the metric by any tags that were attached.
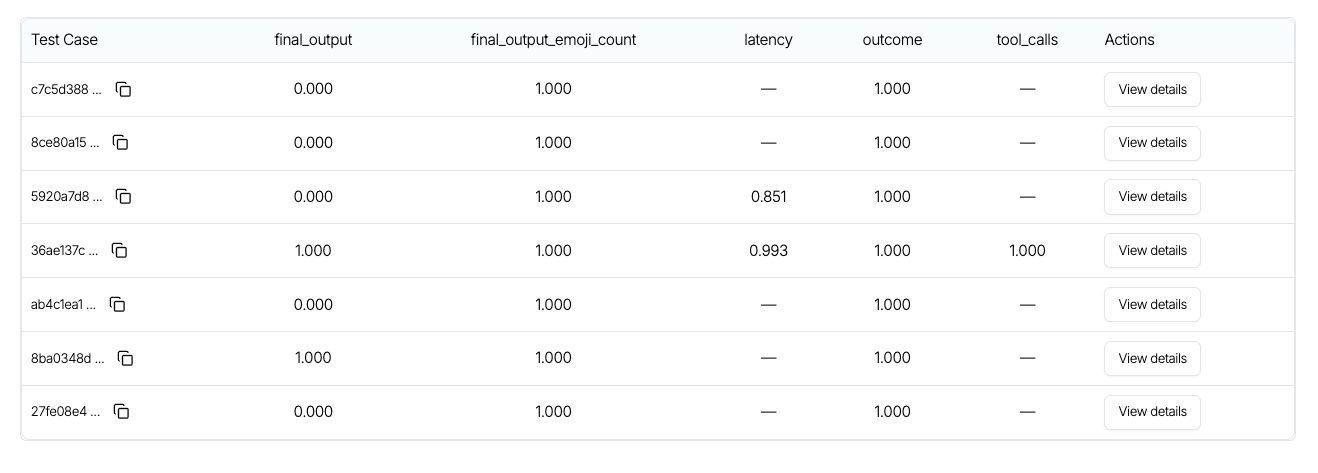
Clicking on a specific run will bring up the detailed summary of each test case from that run.
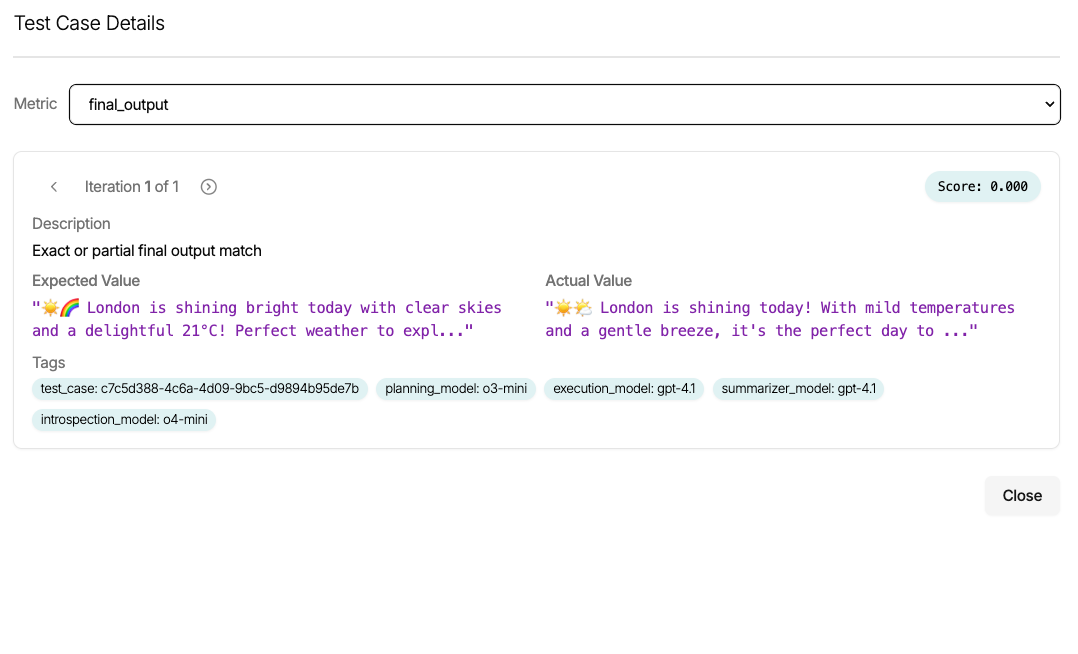
Finally clicking on a specific test case will show you the details of each metric.