Visualise Stream results
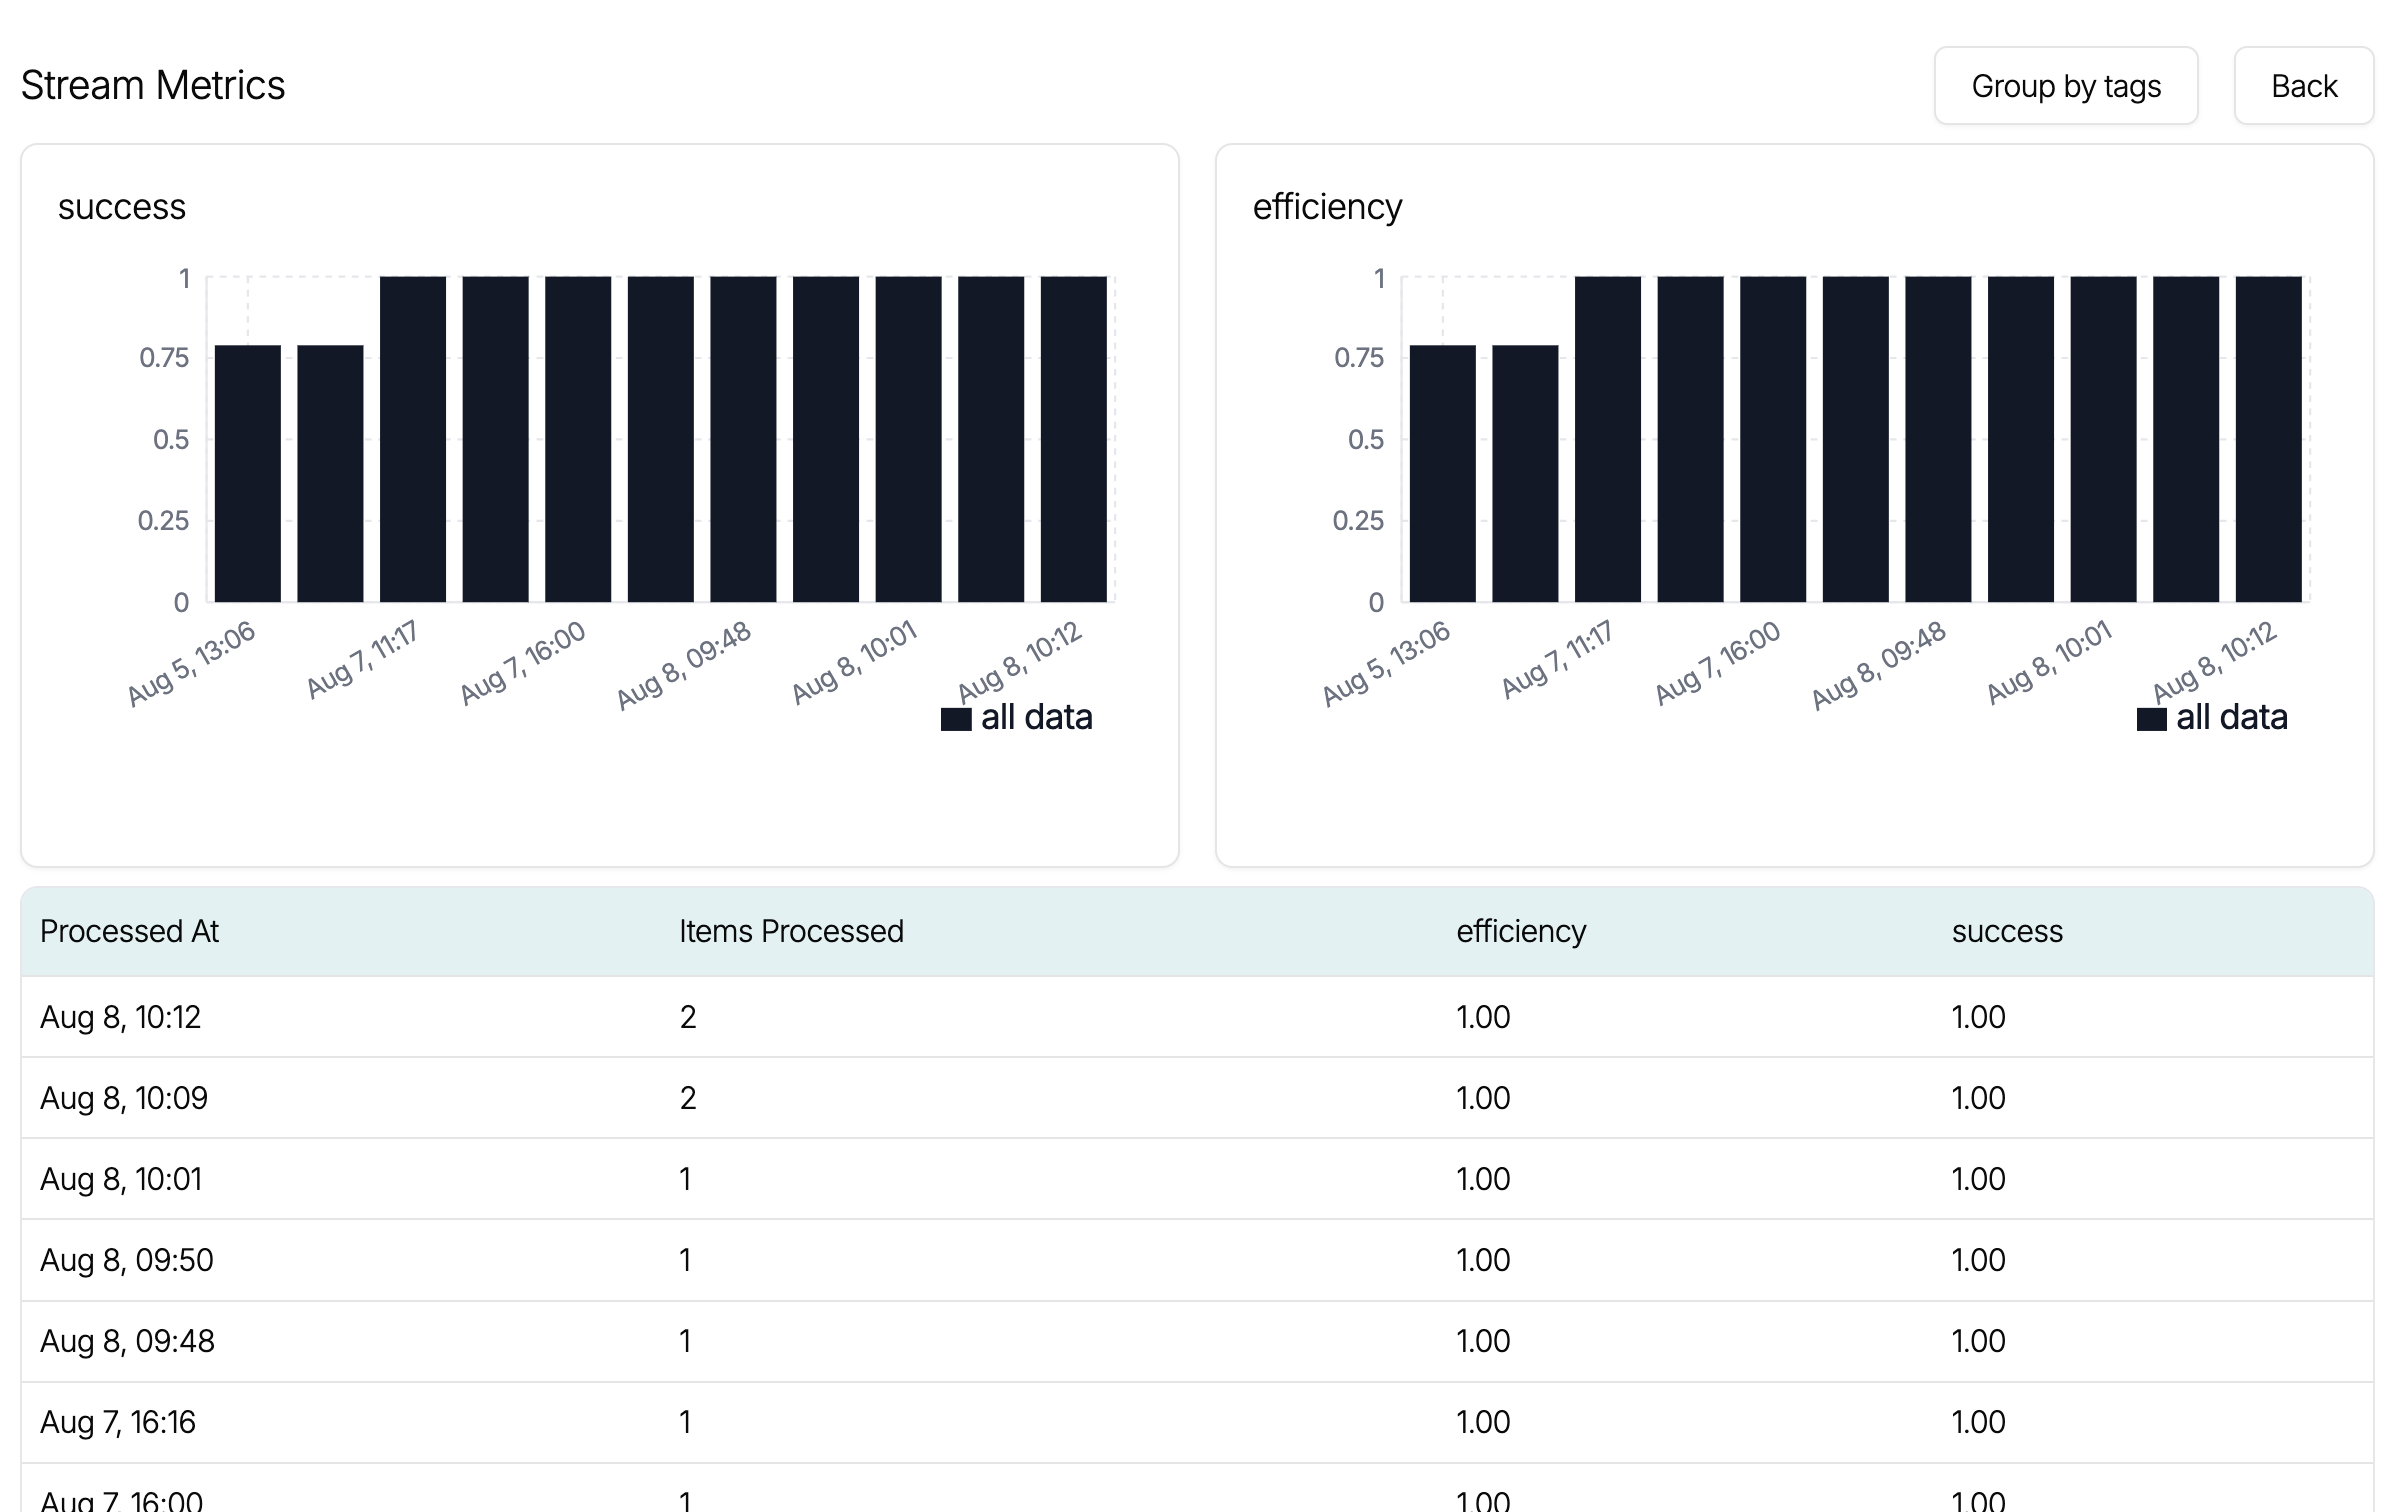
Stream metrics are pushed to the Portia dashboard. Clicking on any stream will show the latest metrics for it grouped by the time of run to show you the performance of the stream over time.
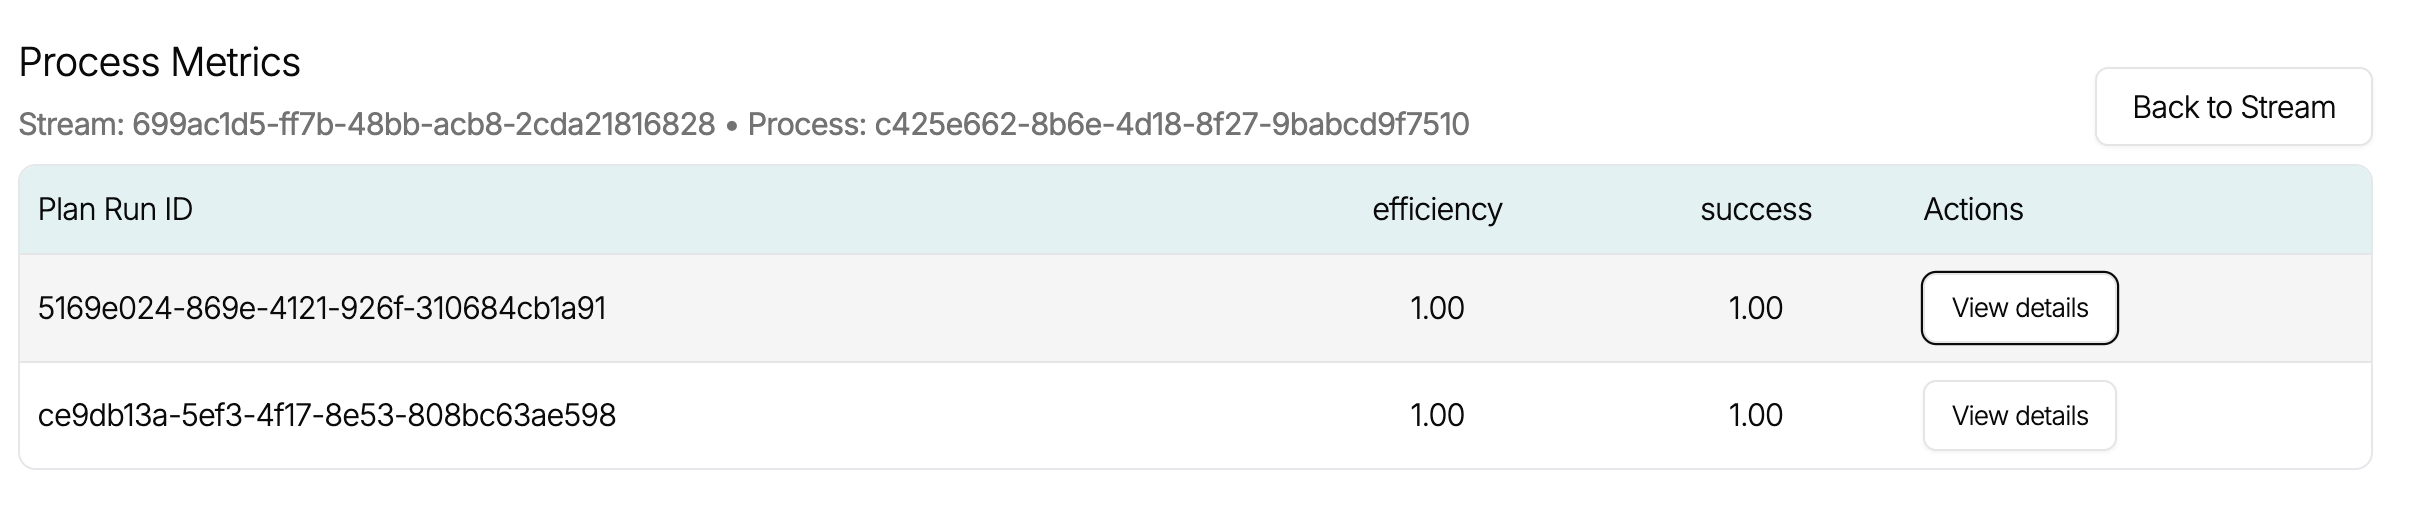
You can also drill down into the analysis by clicking on any row in the table to see a detailed breakdown of the individual plan or plan runs that were processed.
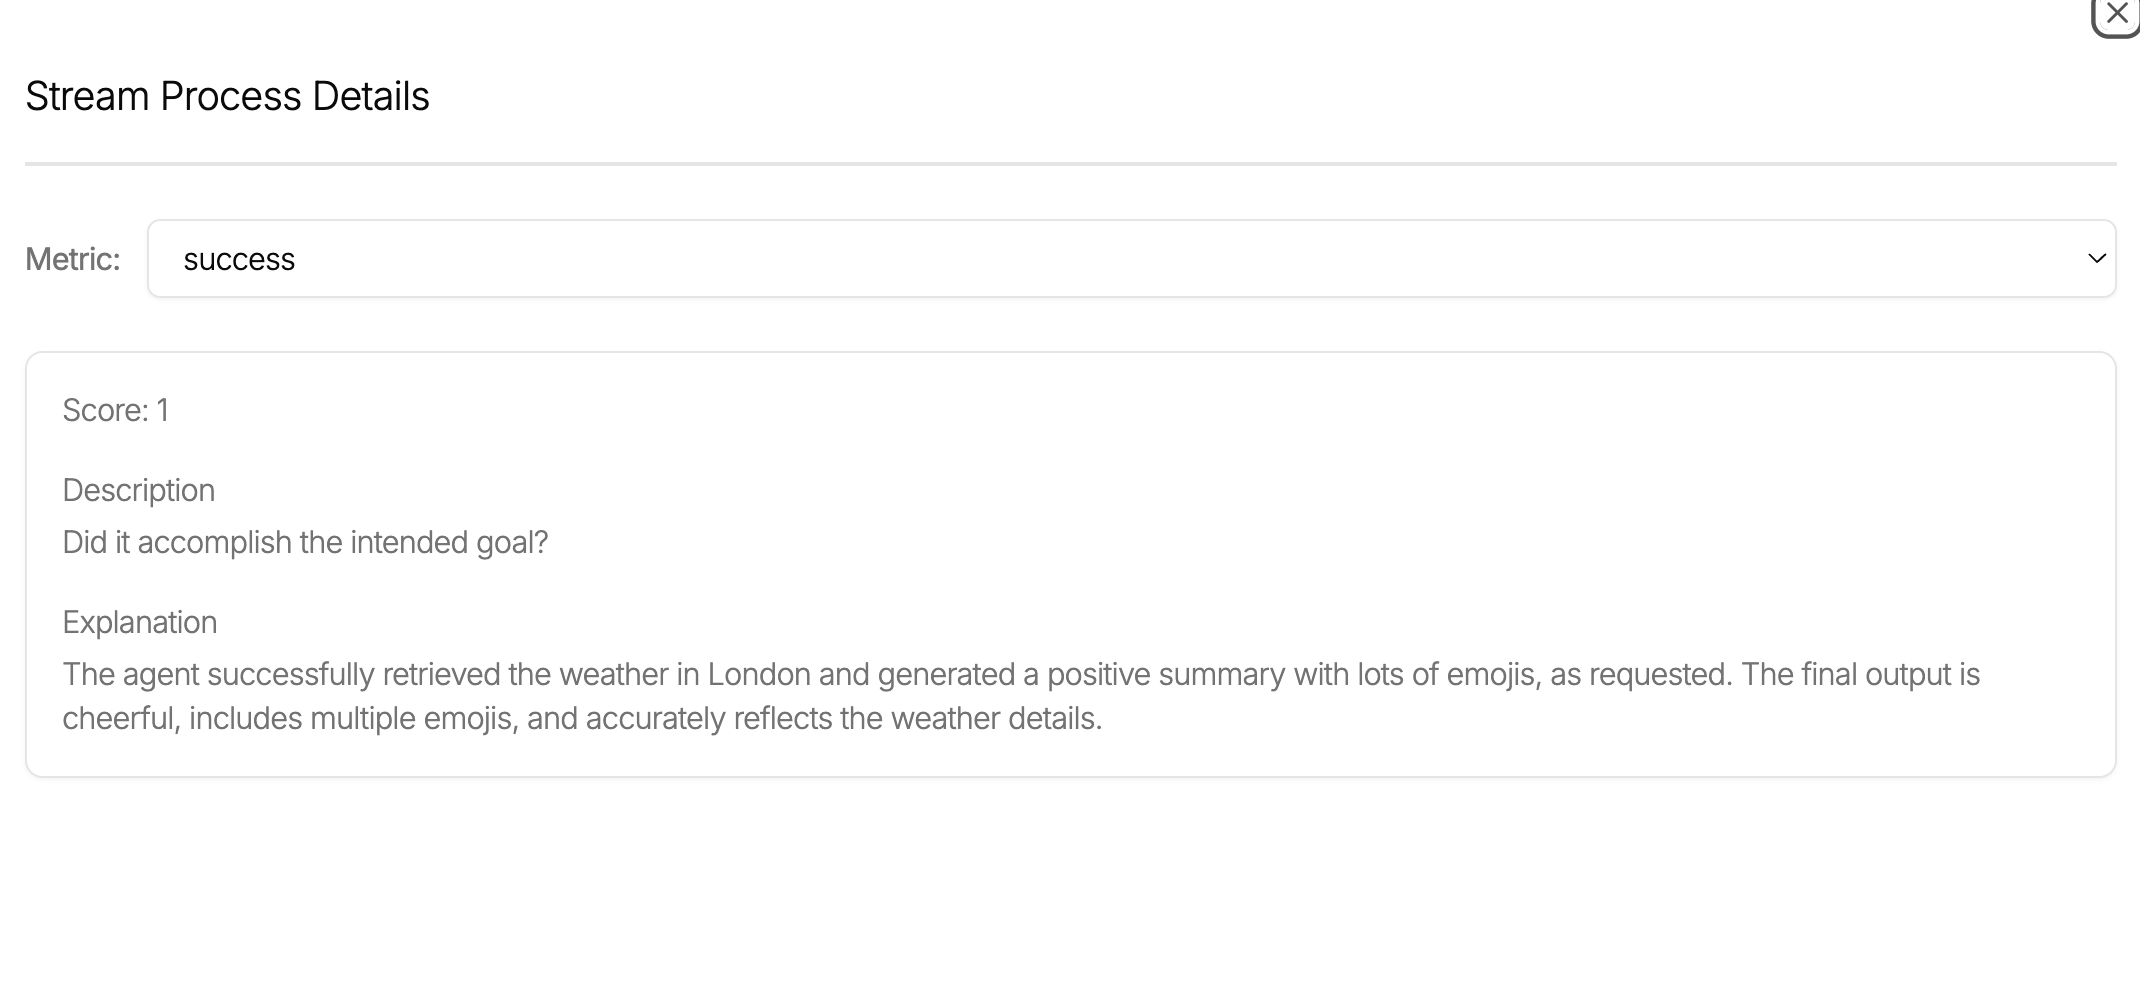
Finally clicking on an individual plan or plan run will show all the specific metrics for that plan run allowing you to see the explanation for scores.