Overview and basic usage
Streams are a way to sample real plans and plan runs from your Portia cloud account allowing you to monitor the performance of your agents in production.
The overall flow is:
- From the Portia dashboard, create a new stream including the desired sampling rate.
- You can rely on the default evaluators offered by Portia or create your own.
- Process your stream periodically to pick up all plan runs that haven't been sampled yet. Steel Thread will process each
PlanorPlanRunin the stream using your preferred evaluators. - Visualize the metrics from each run in the Portia UI.
Please make sure you have a PORTIA_API_KEY set up in your environment to use Steel Thread, as it relies on plans and plan runs stored in Portia cloud.
Basic usage
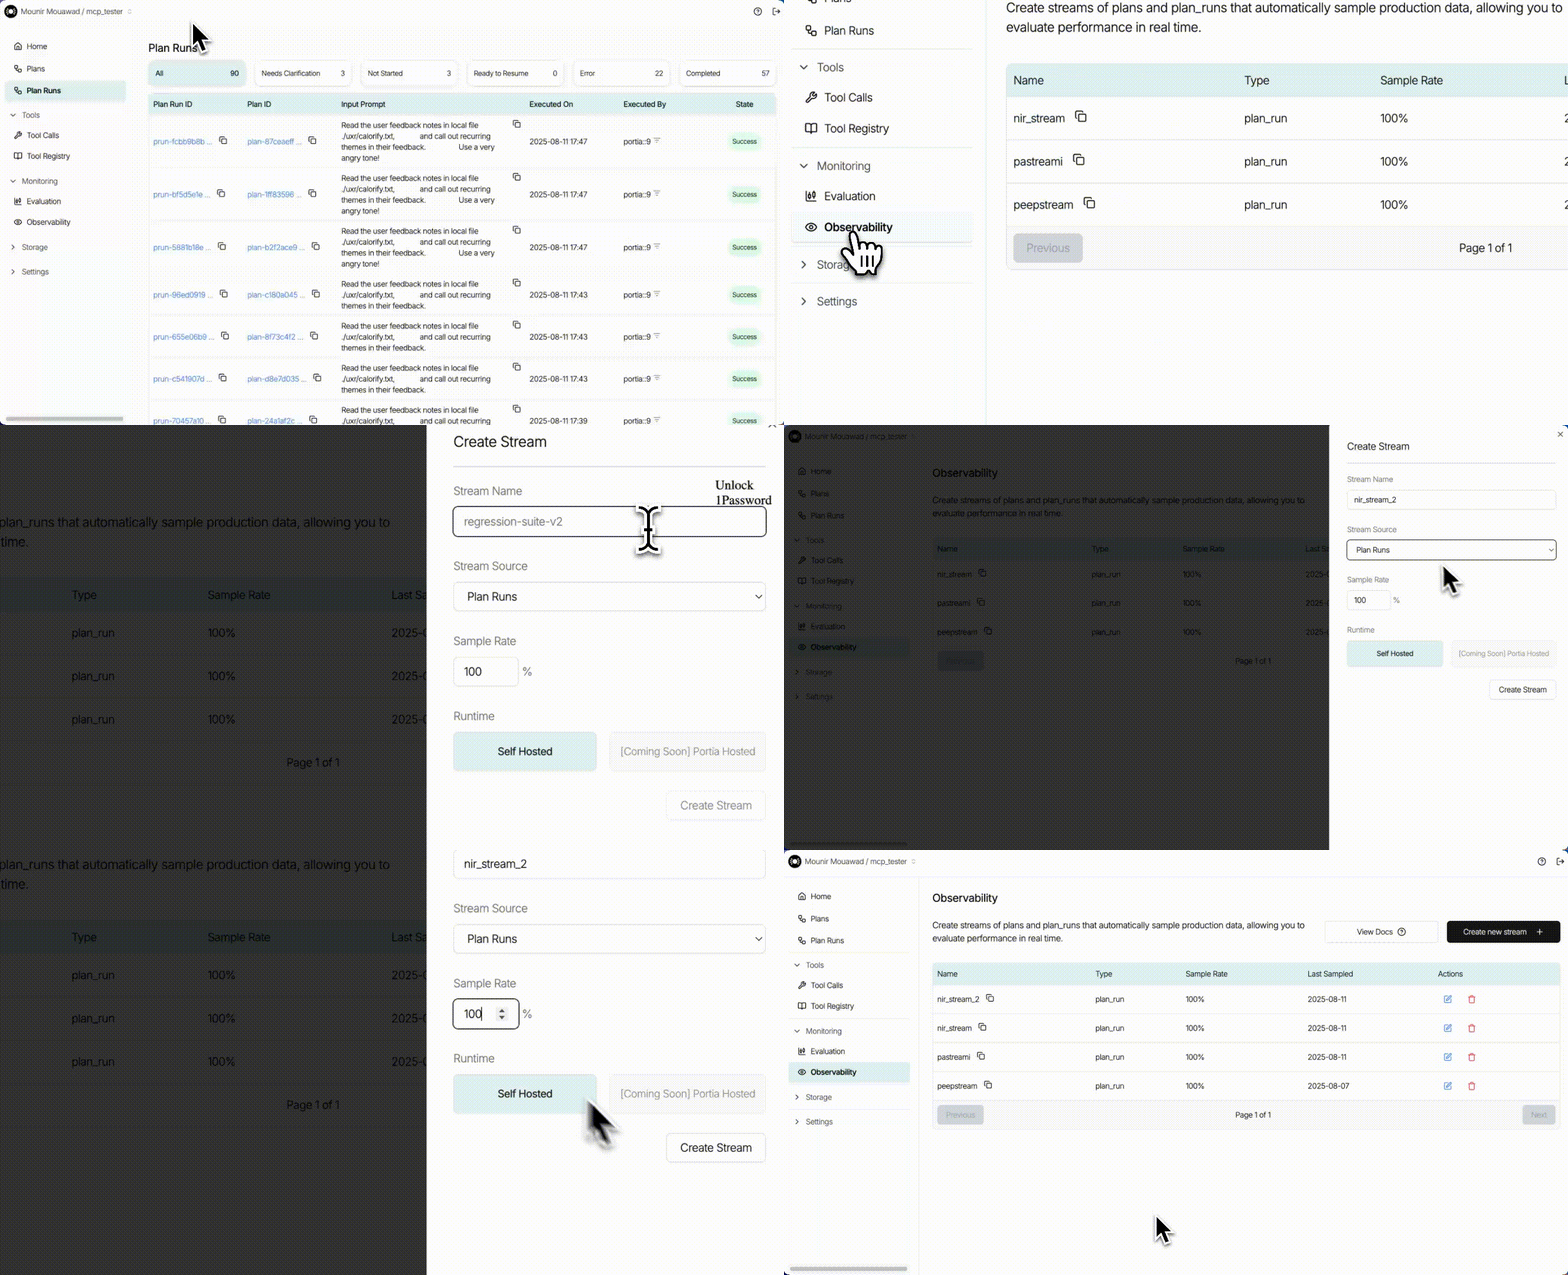
Let's create a Stream from the 'Observability' tab in the dashboard:
- Give your stream a memorable name we can refer to in the code.
- Select 'Plan Runs' as your Stream source -- SteelThread allows you to monitor Plans more specifically if you wanted to.
- Select 100% as your sampling rate for this demo -- We allow you to dial up or down your sampling rate depending on how close an eye you need to keep on your agents.

Now that our Stream is created, it can be used to sample future runs and score based on a number of evaluators. Make sure you have some plan run data generated after the stream is created so that we can sample it as shown below.
from portia import Config
from steelthread.steelthread import SteelThread, StreamConfig
from dotenv import load_dotenv


load_dotenv(override=True)

config = Config.from_default()

# Setup SteelThread instance and process stream
st = SteelThread()
st.process_stream(
    StreamConfig(
        # The stream name is the name of the stream we created in the dashboard.
        stream_name="your-stream-name-here",
        config=config,
    )
)
Default evaluators
The StreamConfig object above takes a list of evaluators (of type StreamEvaluator) as an argument. SteelThread's LLMJudgeEvaluator is available off the shelf and is used by default when no evaluators are specified. It is an LLM-as-judge evaluator and it computes the list of metrics below:
If you're sampling plans:
| Metric | Description |
|---|---|
correctness | Are the steps logically valid? |
completeness | Are all necessary steps included? |
clearness | Are the steps clearly written and easy to follow? |
If you're sampling plan runs:
| Metric | Description |
|---|---|
success | Did the run accomplish its intended goal? |
efficiency | Were the steps necessary and minimal? |
Once you process a stream you should be able to see the results in the dashboard, from the 'Observabilitytab. Navigate to your stream's results by clicking on your stream name from there. You should seesuccessandefficiency` metrics aggregated at the stream processing time stamp. You can drill into the sampled plan runs under each timestamp by clicking on the relevant row in the table.
Every time you process a stream (by running the process_stream method above), SteelThread evaluates all plan runs since the last stream processing timestamp. Think of it as a FIFO queue of plans / plan runs where items are inserted every time you generate a plan / plan run and removed every time you process the stream.